The trend visualizer page can be called using one of three ways: (A) through the table form visualizer (Visualizer: Digest); (B) through the popup menu of the hierarchical tree in the 'Filters' tab (Visualizer: Filters), located in the top menu; or (C) via the address bar of the browser.
(A) Trends via the table form visualizer
The trend information page can be called by selecting the 'Digest' section at the top menu and clicking the mapped object in the digest text.
(B) Trends via the hierarchical tree
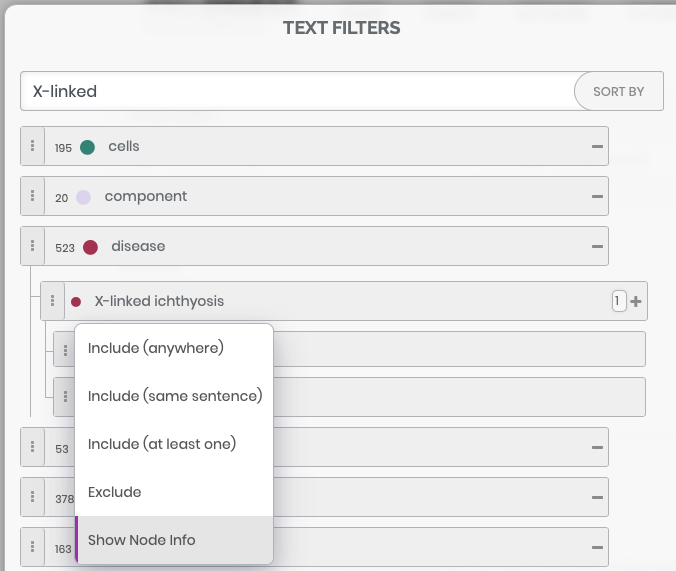
Clicking the 'FILTERS' link in the top menu leads to the appearance of a pop-up window, where a 'TEXT FILTERS' tab contains a tree-like structure of objects. The trends page can be opened by selecting the 'Show Node Info' item of the pop-up menu, which is called by pressing the  button located on the left side of each branch containing the name of a specific object, or one of its synonyms.
(C) Trends via the address bar of the browser
This type of initiation can be useful when displaying or deleting several trends in one window is required. It can be done by editing the 'ids=' parameter in the address line of the browser of the trend visualizer window. The user needs to enter the ANDDigest's id numbers of objects of interest, each of such identifiers must end with the OR word. The ANDDigest identification numbers for objects of interest can be obtained by saving the results in CSV or JSON formats, or from the 'ids=' parameter values in the address lines of individual pages corresponding to these objects. Other two parameters are 'session=' and 'tkn=.' The 'session=' corresponds to the user's ID number; more information regarding the user's ID is available here. The value of the 'tkn=' parameter is determined by ANDDigest automatically; this value required for linking the objects with their identifiers in external databases.

Trend visualizer page
ANDDigest performs computation and visualization of trends providing information about the researcher's interest in objects recognized in digests. Here 'interest' means a dynamics of the distribution of the number of abstracts with reference to the object by years (a period from 1950 to 2018). The visualizer consists of two parts: a textual, containing various object's characteristics, and graphical, reflecting the dynamics of interest in normalized and non-normalized forms, as well as the corresponding linear trends.
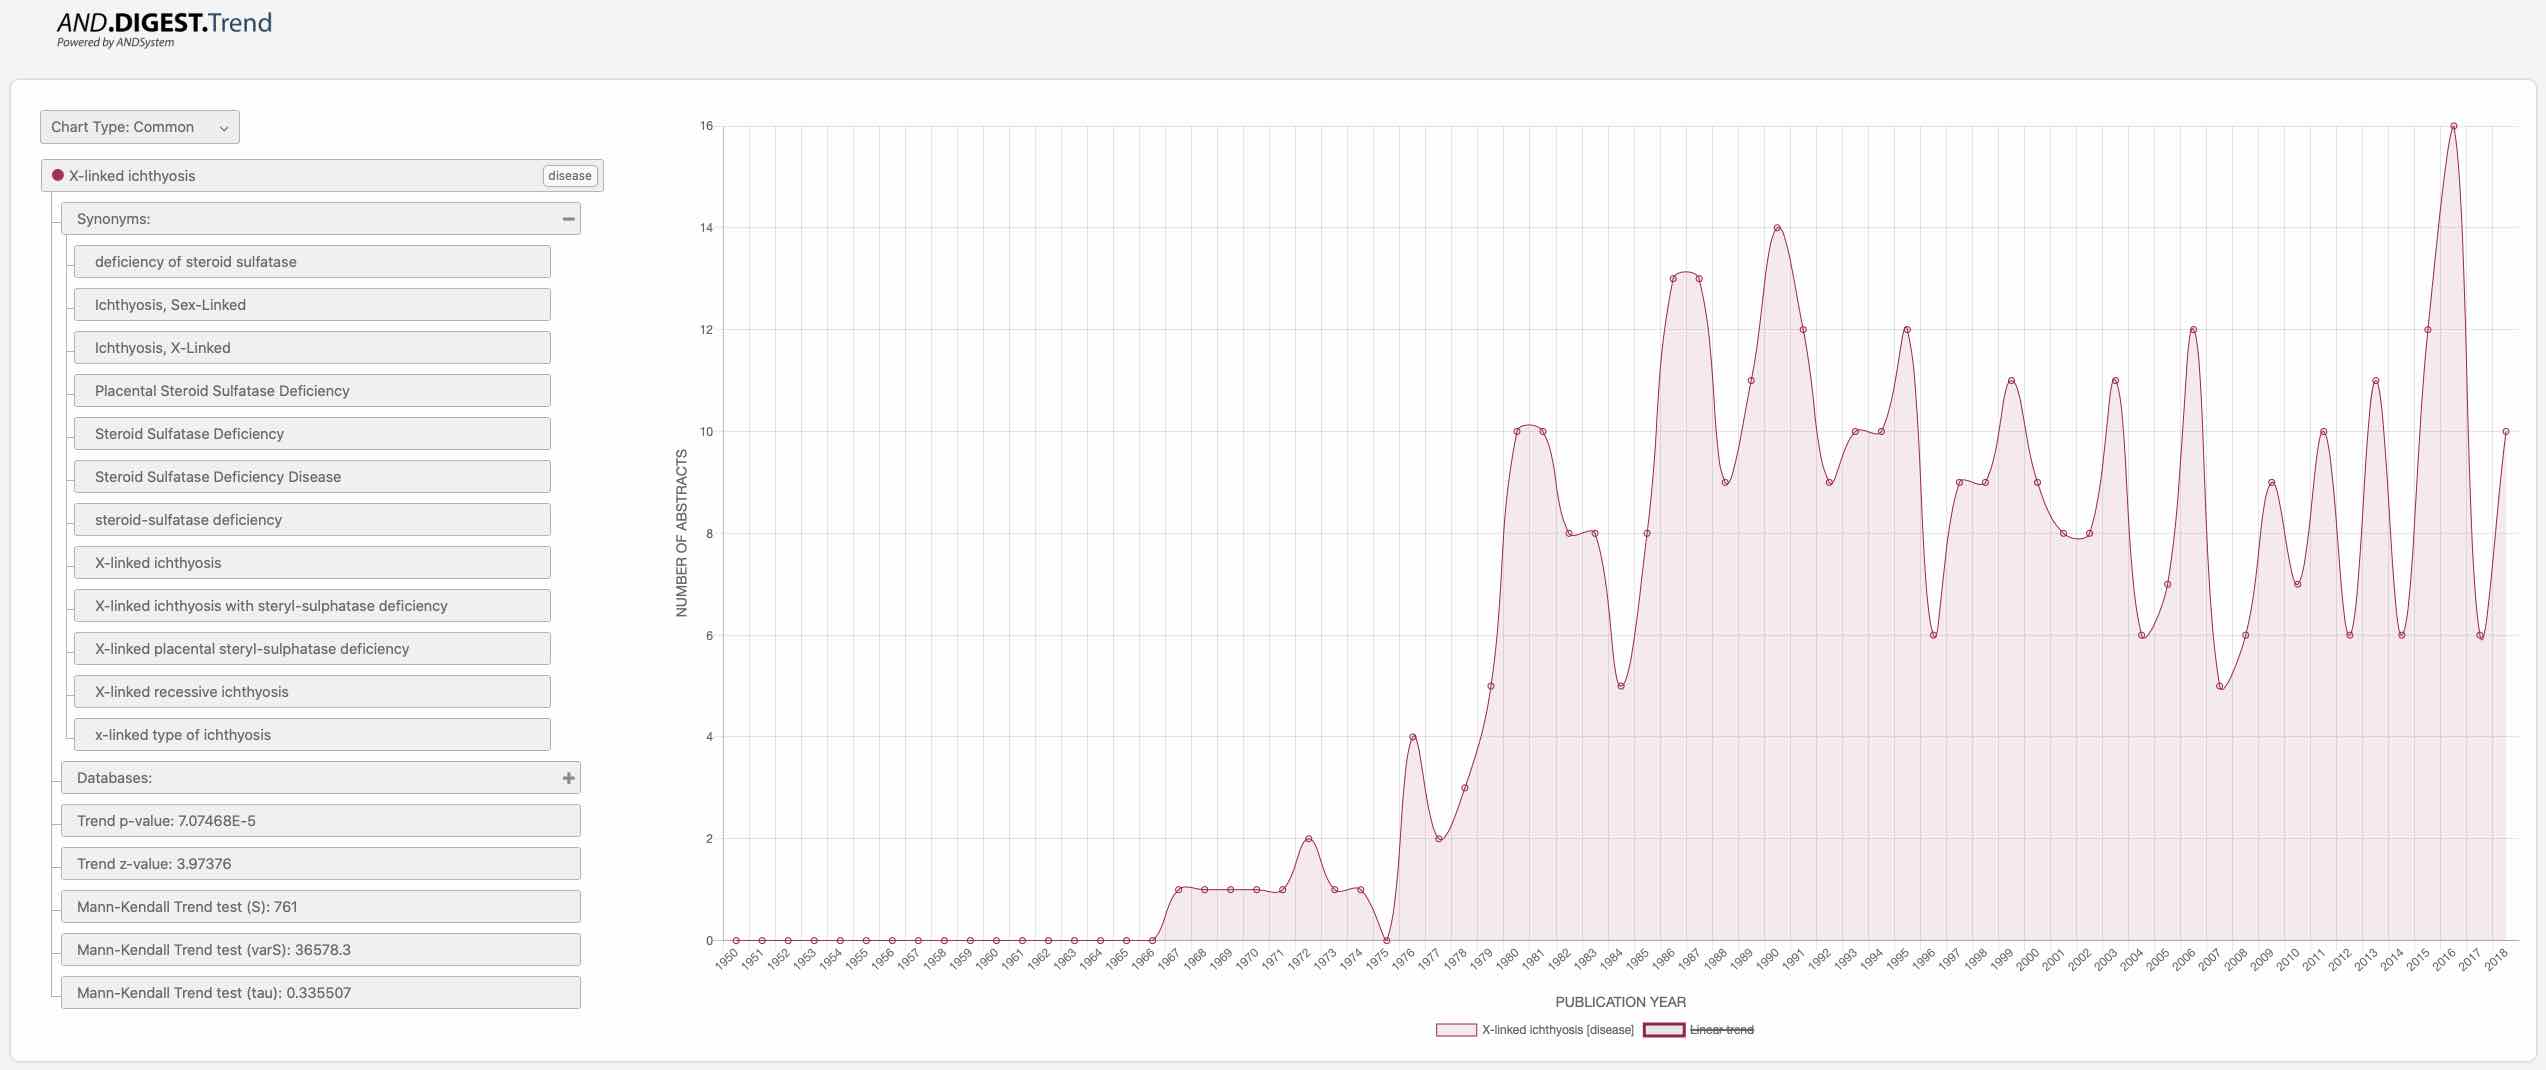
Switching between the non-normalized (Chart Type: Common) and normalized (Chart Type: Normalized) forms of visualization can be performed by selecting the appropriate item from the drop-down menu located in the upper left part of the page.
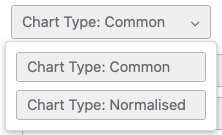
ANDDigest calculates dynamics in two ways: In the first case, only the absolute numbers of articles by every year, containing the object, are considered. In the second case, the number of publications concerning the object in each year normalized to the total number of articles published in PubMed during that year.
Information about objects is presented in a hierarchical form and is located under the menu with chart types, providing the user with the object's data:
- Name and type of the object;

- List of synonyms, which is shown by clicking the
 icon;
icon;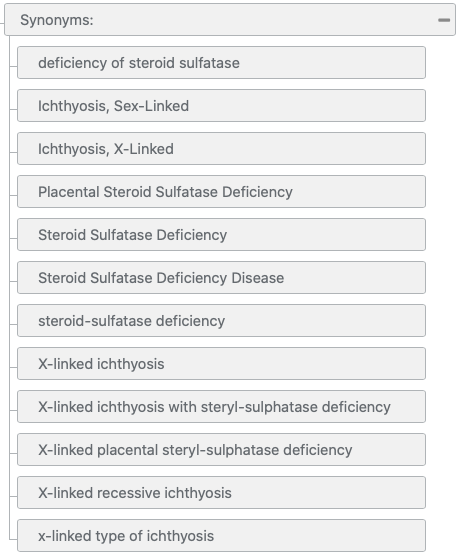
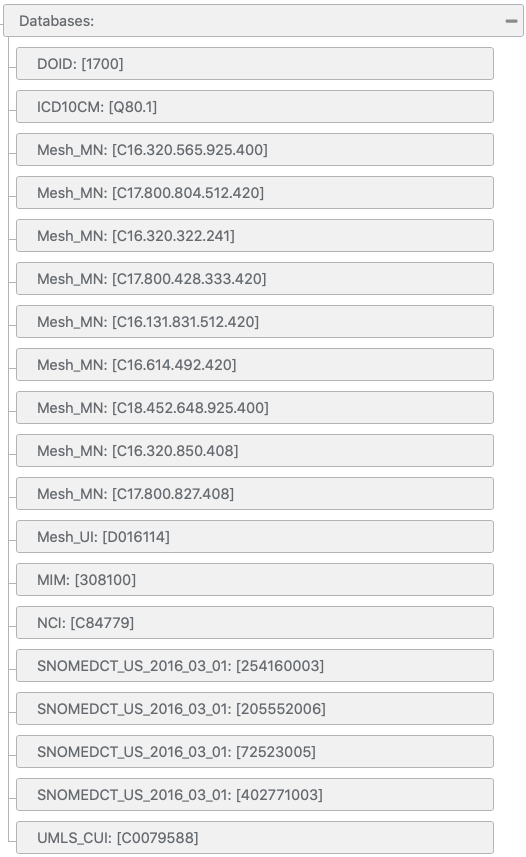
- List of IDs of the object in external databases, which is shown by clicking the icon;
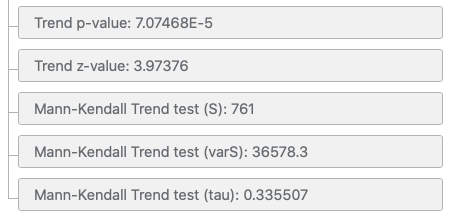
- Object's trend strength indicators are calculated on the basis of normalized dynamics using a nonparametric Mann-Kendall Trend test.
The right part of the window provides a graphical representation of dynamics of interest in objects by years in the form of curves and the linear trend for each curve. The colors of the curves correspond to the object types.
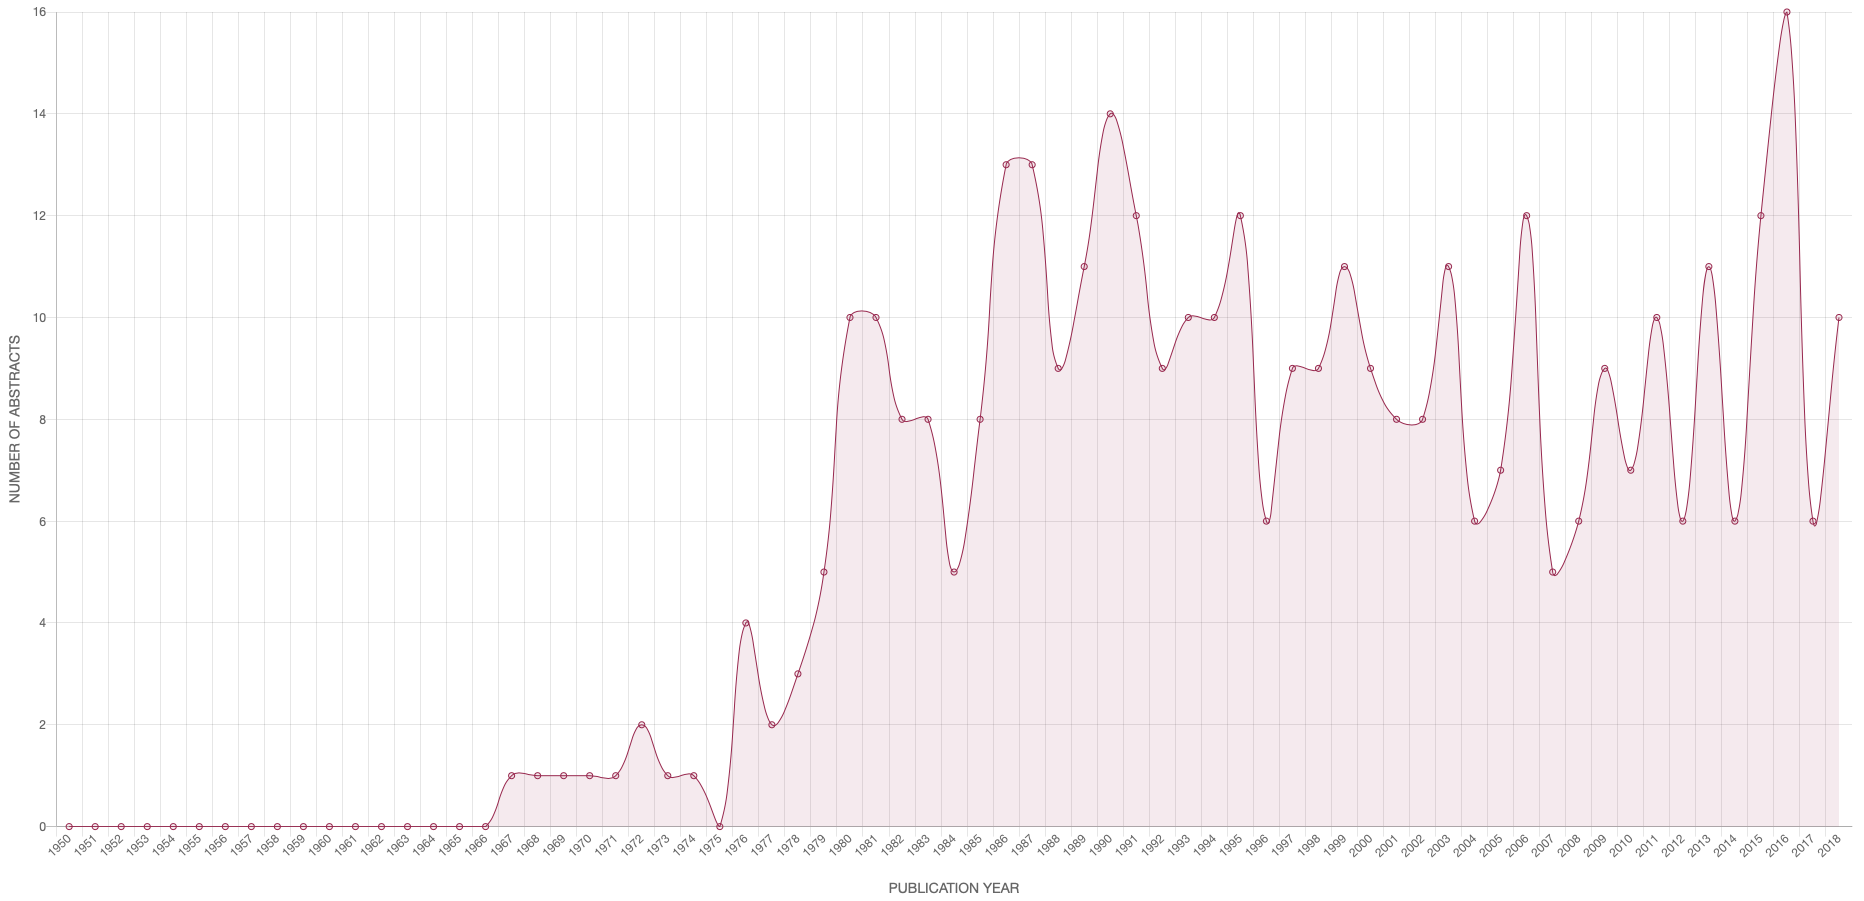
Clicking the element from the legend, which is located under the X-axis, allows hiding/displaying the corresponding curve on the graph.
