A graphical representation of objects specified in a query can be accessed from the top menu via the 'Network' item. Edges of the network illustate pairwise occurrences of objects identified in digests, while each node correspond to the number of digests, mentioning the object. The colors of nodes are related to object types.
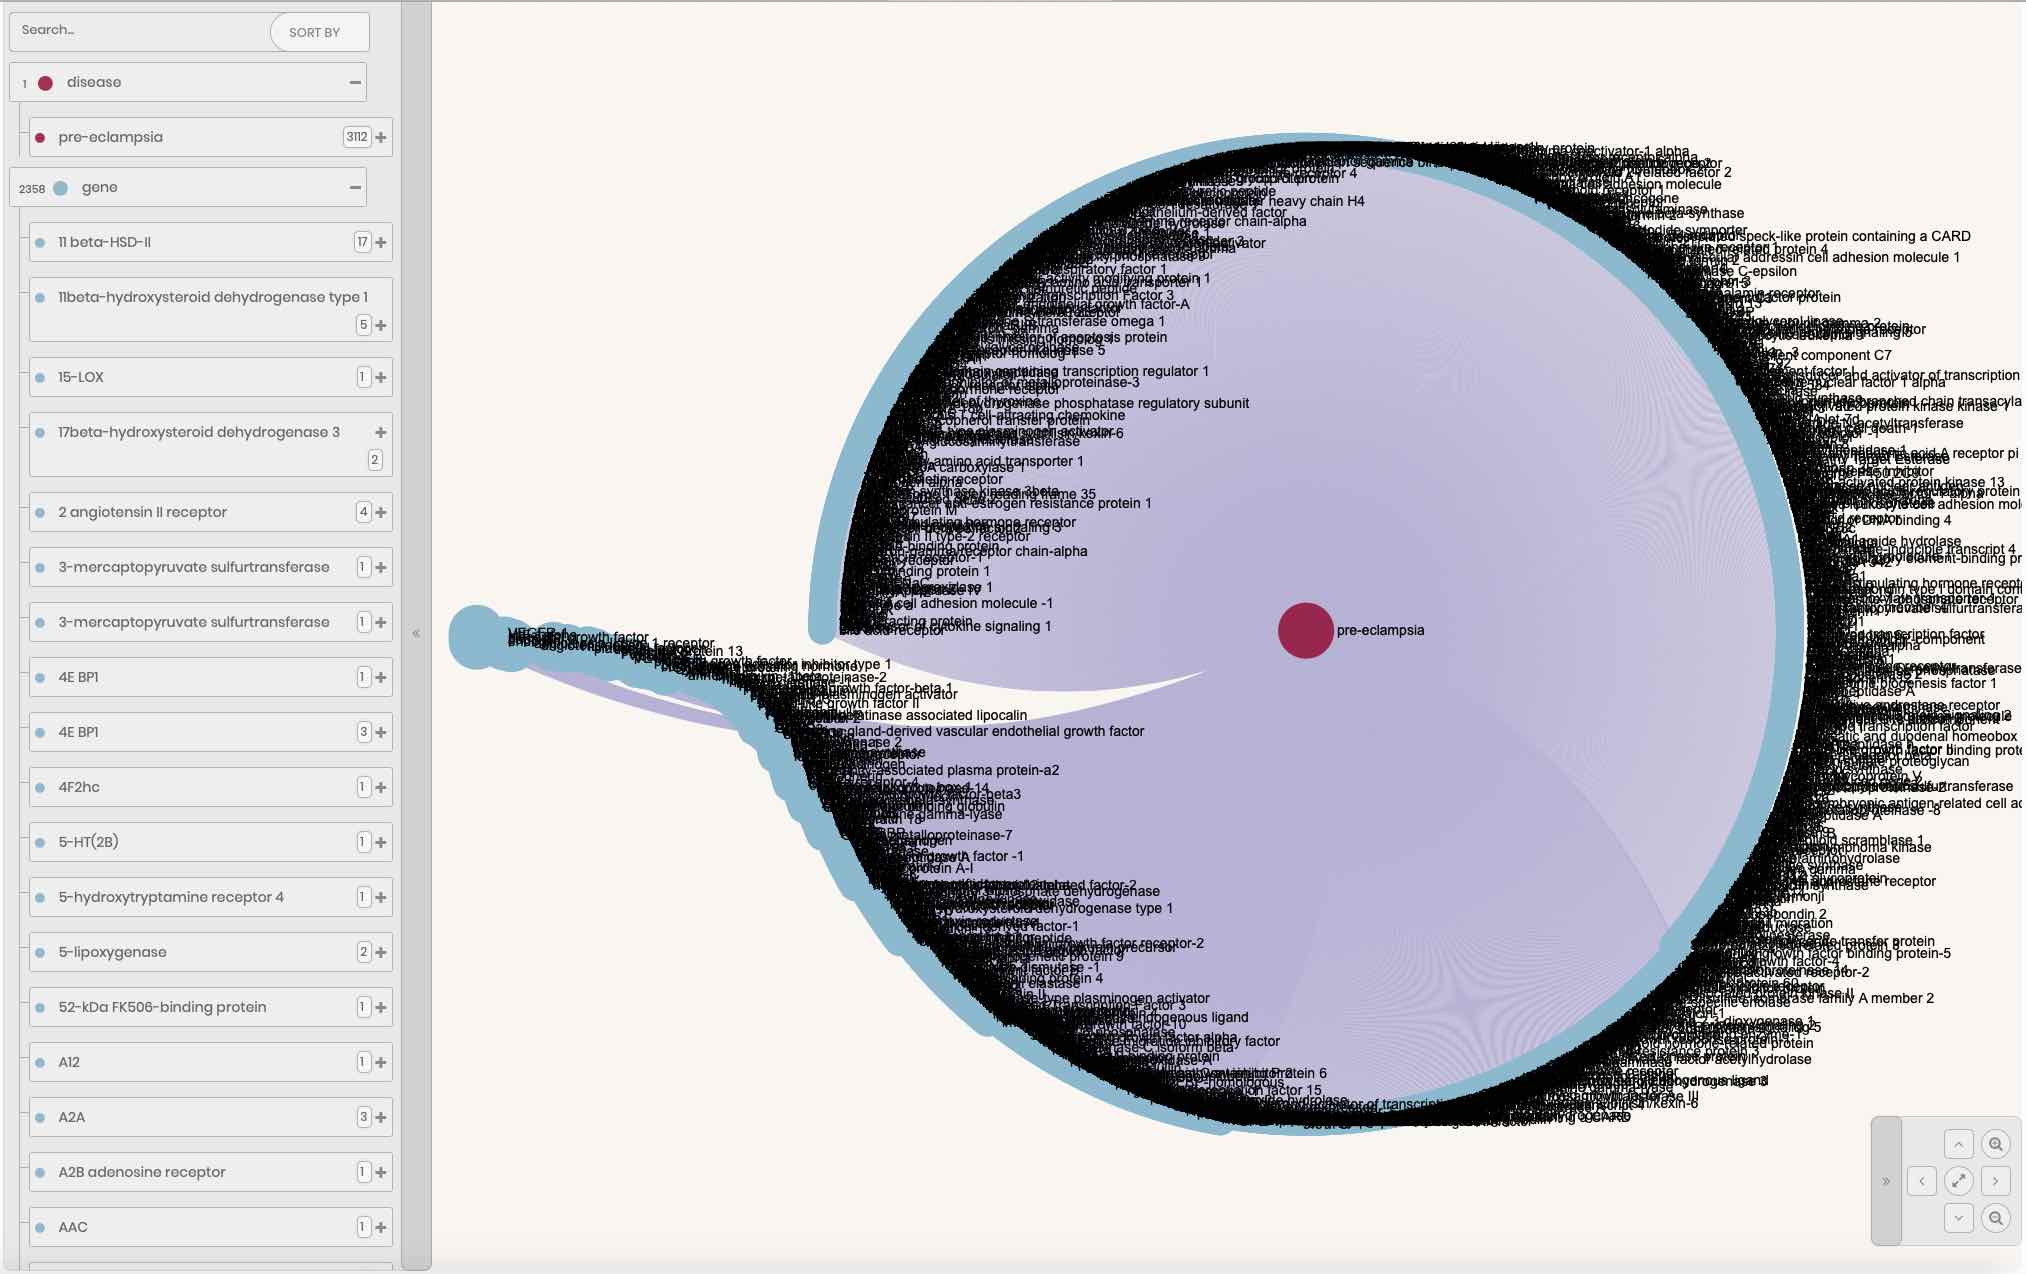
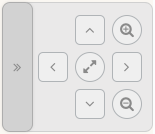
Navigation inside the network can be performed using the mouse or with virtual navigation buttons, located in its bottom-right part.
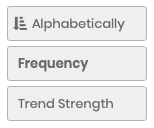
Pressing the '>>' button, at the left part of the network, shows the hierarchical structure of objects from a query. Each element from the structure is described by its type, name, a list of synonyms, frequency, and trend strength value. The sorting in alphabetical order, by a number of trends, containing the object (frequency), as well as by strength of trends of interest, can be done by pressing a  button at the top of the hierarchical structure and selecting an appropriate option, where bold text corresponds to a currently selected option, as well as to numeric values on the right side of branches.
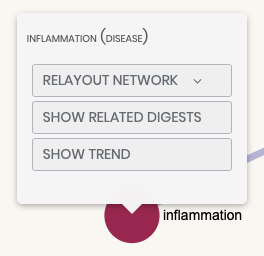
Right-clicking on the visible node in the network shows a popup menu. The menu allows switching layouts of the network and provides information about trend strength of the clicked object; more information about trends is available here. Also, the 'SHOW RELATED DIGESTS' item allows using objects, visible on the network, as a filter, the relationships between them are set via the logical OR.